
1. Effects of time-averaging on species richness
Files: Lecture video, assignment document (pdf or Word), metacommunity model of time-averaging (web app)
The purpose of this exercise is to examine how time averaging affects species richness and similarity among sites. Students complete the in-class assignment after watching the online lecture video and after a practical demonstration of the metacommunity model. Important skills: interpreting graphs, analyzing rates.
2. Substrate adaptations of benthic organisms
Files: Lecture video, assignment document (pdf or Word)
This exercise uses physical models to explore adaptive strategies for life on soft substrates, including the importance of shell density and shape. Students watch the online lecture video before the in-class exercise. Important skills: quantitative reasoning, applying physics knowledge.
3. Coral colony integration and reef building
Files: Lecture video, assignment document (pdf or Word), R code for data acquisition and plotting (requires internet access), corallite illustrations (reefbuilder_id file)
In this exercise, students categorize coral families as low or high integration and compare the abundance of corals in reefs during the Jurassic (using Paleobiology Database data) to the prevalence of highly-integrated corals. The exercise also compares integration and reef occurrences of Permian tabulate corals to Jurassic corals. Important skills: fossil identification, interpreting graphs.
4. Morphology and species classification
Files: Lecture video, assignment document (pdf or Word), R code for data analysis and plotting (requires internet access), ammonoid photos.
This exercise asks students to group a set of ammonoid specimens into species, considering intraspecific variability, ontogenetic shape change, and potential sexual dimorphism. They create hypothesized species groups and then test those groupings by plotting quantitative shell shape parameters. Important skills: fossil identification, interpreting graphs.
5. Cladistics and phylogenies
Files: Lecture video, assignment document (pdf or Word).
This is the first introduction to constructing and interpreting cladograms, using very simplified (non-realistic) characters. Students watch the video to learn about concepts like parsimony and key terms (synapomorphy, monophyletic, etc.) and then apply that knowledge to the exercise. Cladistics is covered in later exercises, labs, and in the final project. Important skills: interpreting evolutionary hypotheses.
6. Ontogeny and heterochrony
Files: Lecture video, assignment document (pdf or Word).
This exercise involves analysis of heterochrony in ancestor-descendant pairs, using three different taxonomic groups (bivalves, trilobites, and echinoids) and different ways of presenting morphological data (pictures and graphs). Important skills: interpreting graphs, analyzing rates.
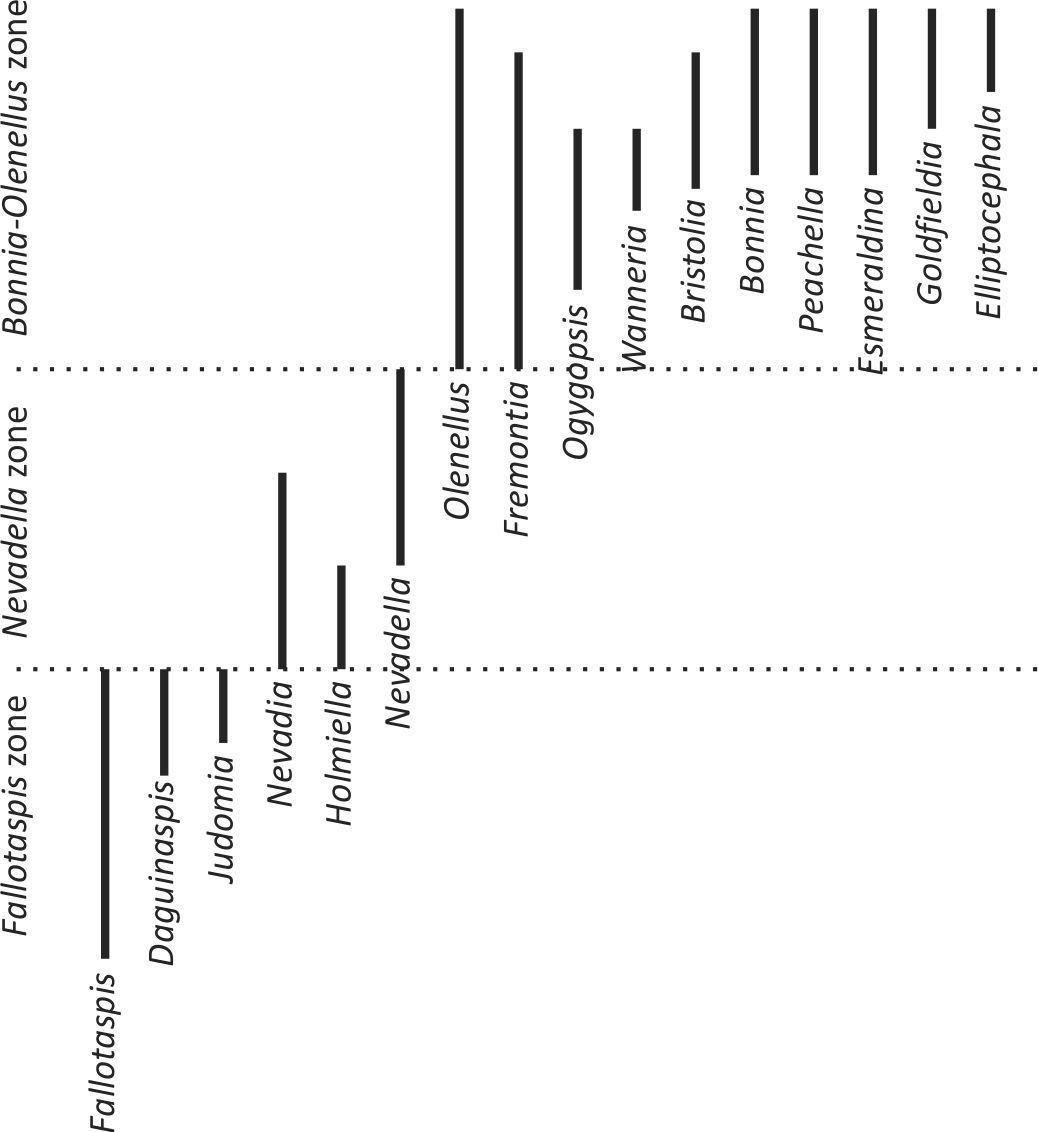
7. Biostratigraphy and index fossils
Files: Lecture video, assignment document (pdf or Word), R code to model stratigraphic distributions under varying abundance and facies preference conditions.
Students consider the characteristics found in good index fossils and how the difference between true and observed first appearances can be influenced by fossil abundance and facies preference. Important skills: interpreting graphs.
8. Biogeography
Files: Lecture video, assignment document (pdf or Word), R code for cluster analysis of biogeography, raw presence/absence data (csv format).
This exercise introduces quantitative approaches for biogeography (which are later used in the third paper) and applications to plate tectonics and paleogeographic reconstruction. Important skills: interpreting graphs, quantitative reasoning.
9. Vicariance and dispersal
Files: Lecture video, assignment document (pdf or Word), presence/absence data file (biogeog_data).
Builds upon previous exercises (biogeography, cladistics) to consider how evolutionary events may have been influenced by vicariance and/or dispersal. The role of biological factors (larval type) and paleogeographic causes (sea level change) are also considered. Important skills: interpreting graphs, interpreting evolutionary hypotheses.
10. Evolution: pattern and process
Files: Lecture video, assignment document (pdf or Word), R files for simulations (morphEv.R and speciation.R).
This exercise uses simple simulations to consider how gene flow and population size may influence speciation. Students also run other numerical simulations to compare phyletic gradualism vs. punctuated equilibrium and assess how random walks within a fitness landscape can lead to punctuated evolutionary pattern. Important skills: quantitative reasoning, interpreting evolutionary hypotheses.
11. Evolutionary trends
Files: Lecture video, assignment document (pdf or Word), R code for data analysis, conodont and foram datasets.
This exercise covers methods that can be used to distinguish evolutionary trends from random walks. Students simulate a bounded random walk using coin flips and analyze that data. They then apply those findings to hypothetical fossil data and, finally, use Gene Hunt's paleoTS R package to analyze real data. Important skills: interpreting graphs, quantitative reasoning.
12. Extinction and origination
Files: Lecture video, assignment document (pdf or Word), R code for null model of declining extinction rates, R code for analyzing trilobite, brachiopod, and bivalve extinctions.
There are three parts to this exercise. The first considers whether declining extinction rates over the Phanerozoic are better explained by a null model or by increasing evolutionary adaptation. The second compares selectivity on a variety of traits [I'm likely going to cut this part for 2016]. The third evaluates the Signor-Lipps effect. Important skills: interpreting graphs.
13. Diversity: temporal trends and biases
Files: Lecture video, assignment document (pdf or Word).
This exercise focuses on challenges inherent to measuring diversity in the fossil record (methods for counting diversity, the effects of sampling on diversity) and on possible controlson temporal trends in diversity.
14. Diversity: spatial and environmental patterns
Files: Lecture video, assignment document (pdf or Word), R code for latitudinal diversity gradients, bivalve age and bivalve latitude files.
Students first use data from the Paleobiology Database to generate past latitudinal diversity gradients for selected groups, in order to test whether a latitudinal diversity gradient has been a common feature throughout the history of life. They then use hypothetical data on the origination time and location, as well as geological duration, to test models for the generation of a latitudinal gradient (the Out-of-the-Tropics model of Jablonski). Important skills:analyzing rates, quantitative reasoning.
15. Guilds and evolutionary faunas
Files: Lecture video, assignment document (pdf or Word), diversity curve plots, brachiopod order abundance plot.
In this exercise, students think about ecological change at a variety of temporal and taxonomic scales, from evolutionary faunas, to ecological-evolutionary units, to guilds. The exercise also links back to previous content to consider how biological interactions and biological ecosystem engineering may have contributed to shifts in guild composition over time. Important skills: interpreting graphs.
1. Environmental reconstruction using life and death assemblages. This is a larger project and the first paper in the class, involving in-class work during two class periods. This assignment gives experience with data analysis, especially using fossil data to solve an applied environmental problem. The interpretation of the data builds upon the taphonomy and time-averaging material previously covered. I first ask students to consider the types of data they could collect to solve the problem, and then get them to choose specific sites and sample sizes to fit within a specified budget.
Files: Assignment document (pdf), writing guidelines (pdf or Word), R code for ordination, R code for rarefaction, R code to generate life/death assemblage species counts (only needed by instructor). Video with background on ordination.
2. Ecology of Cambrian archaeocyath reefs. Students analyze data collected on the class field trip, which visits Lower Cambrian reefs in the Poleta and Harkless Formations in western Nevada. In the field, students use grids to conduct point counts of reef component abundances (archaeocyaths, microbial fabric, and cavities) and measure archaeocyath diameter and central cavity diameter. The project compares data among three different sites and the students interpret potential biological and environmental controls and relate their findings to published work by Rowland and Gangloff (1988, Structure and paleoecology of Lower Cambrian reefs, Palaios, v. 3, p. 111-135).
Files: Assignment document (pdf or Word), R code for plotting results.
3. Morphometrics, heterochrony, and biogeography of olenellid trilobites. This is the final project for the class and brings together material on ontogeny, heterochrony, cladistics, biostratigraphy, biogeography, and vicariance/dispersal. Students use the free software tpsDig to digitize landmarks on photos of trilobite cephalons from the White-Inyo Mountains and, I think, from the Marble Mountains (plus some specimens taken from the literature). I collate the landmark files and perform the Procrustes superimposition, then the students perform principal components analysis to quantify the shape. In the second part of the project, students use (made-up, not real) data on the distribution of trilobite genera to analyze their biogeography and combine those findings with their cladogram to discuss the role of dispersal and vicariance in trilobite evolution.
Files: Assignment document (pdf or Word), instructions for landmark digitization (pdf or Word), video describing landmarks and morphometrics, R code for landmark PCA, R code for phylogenetic analysis, R code for biogeographic analysis, trilobite stratigraphic ranges (not real data), paleogeographic map (not real data), trilobite cephalon images.